SQL Server on Linux – External Memory Pressure
In this blog post we’re going to explore how SQL Server on Linux responds to external memory pressure. On Windows based SQL Server systems we’ve become accustomed to the OS signaling to SQL Server that there’s a memory shortage. When signaled, SQL Server will kindly start shrinking it’s memory caches, including the buffer pool, to maintain overall system stability and usability. We’ll that story is a little different in SQL Server on Linux…let’s look and see how SQL Server on Linux responds to external memory pressure
The Scenario
Our SQL Server on Linux system is a CentOS 7.4 VM, running SQL Server 2017 (RTM). There is 12GB of physical memory and 80% of that is dedicated to SQL Server via mssql-conf about 9.2GB, the default configuration. I’ve also set Max Server memory to 8GB.
So let’s start up SQL Server on Linux and query the buffer pool cache sizes when there’s no data loaded. I’m going to look in two places. sys.dm_os_memory_clerks and also sys.dm_os_buffer_descriptors. In Figures 1 and 2, we can get a feel for the memory distribution across the system and also inside the buffer pool.
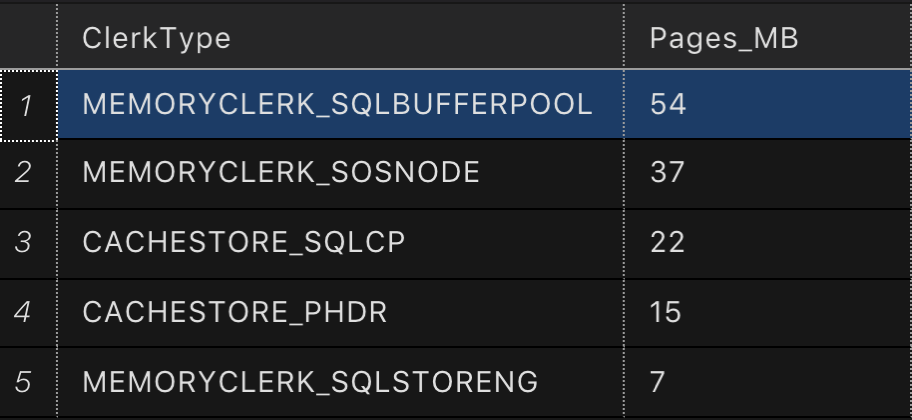
Figure 1 – Top memory consumers at system startup
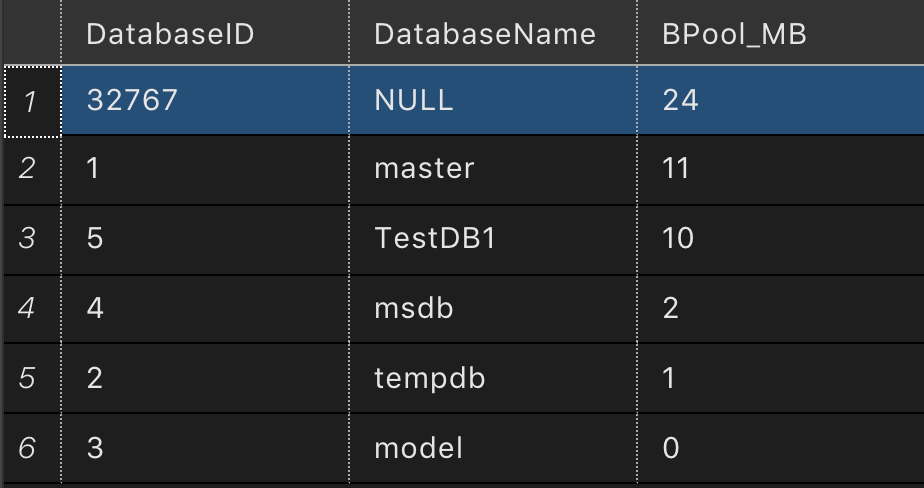
Figure 2 – Buffer Pool memory distribution at system startup
Now, I’m going to load a 8GB table into the buffer pool, maxing out SQL Server’s MAX memory instance setting. Now we’ll look at the allocations again. In Figures 3 and 4, we can see the buffer pool is the dominant consumer of memory and that our database is the dominant consumer in the buffer pool. So far so good, eh?
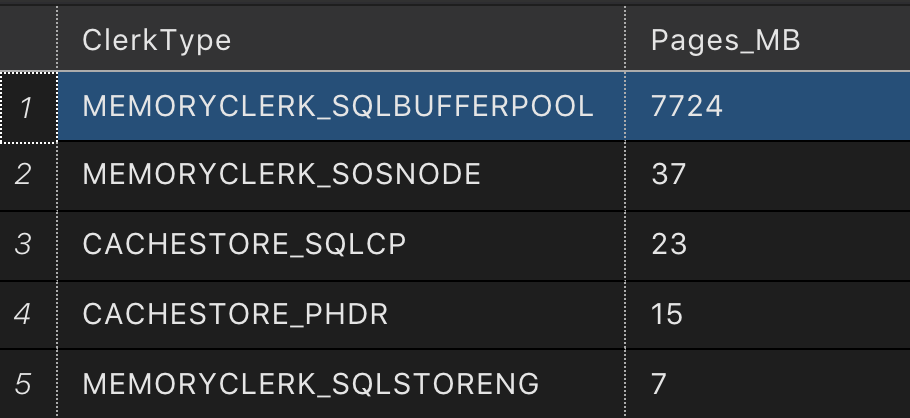
Figure 3 – Top memory consumers after server reached maximum memory
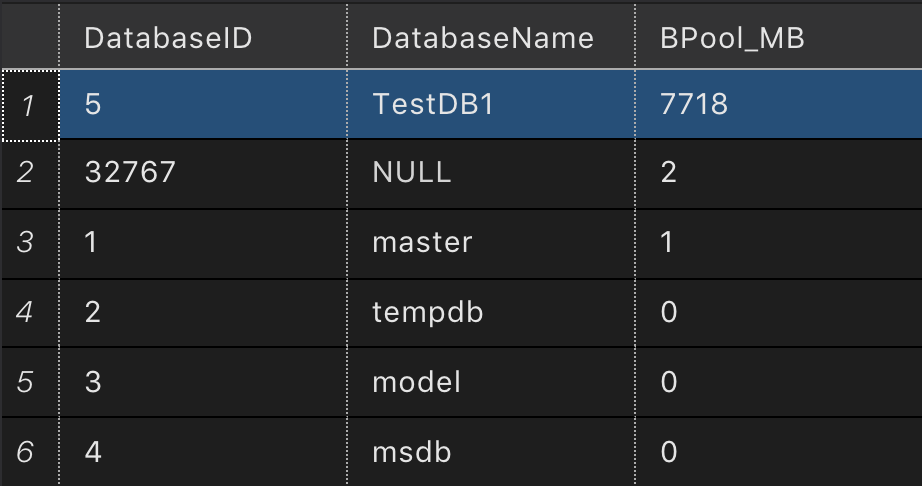
Figure 4 – Buffer Pool memory distribution after table loaded.
Getting Memory Information From Linux
We can use tools like ps, top and htop to look our are virtual and physical memory allocations. We can also look in the /proc virtual file system for our process and look at the status file. In here we’ll find the point in time status of a process, and most importantly the types of memory allocations for a process. We’ll get granular data on the virtual memory allocations and also the resident set size of the process. Here are the interesting values in the status file we’re going to focus on today.
- VmSize – total current virtual address space of the process
- VmRSS – total amount of physical memory currently allocated to the process
- VmSwap – total amount of virtual memory currently paged out to the swap file (disk)
We can use the command pidof sqlservr to find the process ID for our SQL on Linux process, in our case it’s 14689. When running SQL Server on Linux there is always two processes for sqlservr, we’re going to look the one with the higher process ID.
Now to access the status information for our process we look in /proc/14689/status
Below is the output from our process’ status file, filtering for the values we’re interested in. You can see about 10.16GB of Virtual Memory (VmSize), 7.82GB of which is in actual RAM (VmRSS) and 622MB in the swap file (VmSwap). Nothing special to see here, just the baseline information for our process with a populated buffer pool.
VmSize: 10661380 kB
VmRSS: 8201240 kB
VmSwap: 636952 kB
Let’s Add Some Pressure
Using a small C program I wrote, I use calloc to allocate large sections of memory and then I have the program continually write data into the memory buffer to ensure those pages stay in physical memory. Using this program, let’s allocate 4GB of RAM. I’m choosing this value because it’s going to cause my system to exceed it’s physical memory but NOT exceed the amount virtual memory in my system when including the swap file’s size. Things can get really dicey if you exceed physical and virtual memory size, processes will start to get killed. Microsoft documents a case here.
Let’s look at the memory data from /proc/17141/status for my memory allocator program. In the output below you can see we have just about 4GB of virtual memory (VmSize) allocated and nearly the same amount of memory that’s resident in physical memory (VmRSS) and no data in the swap file.
VmSize: 4198476 kB
VmRSS: 4194484 kB
VmSwap: 0 kB
Now that 4GB program has caused Linux to need to make room in physical memory for this process. It does this by swapping least recently used pages from memory out to disk. So under memory pressure, let’s look at the SQL Server process’ memory allocations according to Linux. In the output below we see we still have a VmSize of around 10GB, but our VmRSS value has decreased dramatically. In fact, our VmRSS is now only 3.53GB. It decreased by 4.29GB! VmSwap has increased to 5.04GB. Wow, that’s a huge portion of the process swapped to disk.
VmSize: 10843320 kB
VmRSS: 3705476 kB
VmSwap: 5289752 kB
What Does SQL Server Think About All of This?
With our memory allocation program running and no workload running inside SQL Server, let’s look at sys.dm_os_memory_clerks and sys.dm_os_buffer_descriptors again. Something interesting happens, in Figures 5 and 6, when we look at sys.dm_os_memory_clerks and sys.dm_os_buffer_descriptors things changed but only slightly But from the data above we do know that only 3.54GB of the process is actually in memory (VmRSS) at this point. Which means a large portion of SQL Server’s process is actually NOT in memory anymore…they’re on disk. The reality is, we simply do not know which portions of the process are in memory or on disk at this level. You could use tools like pmap to determine which sections of memory are on disk, but we’ll leave that for another day. Try it out…it’s fun ;)
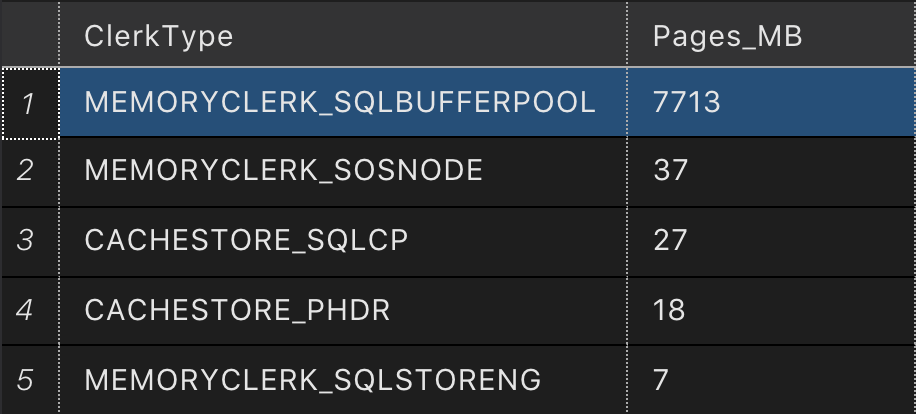
Figure 5 – Top memory consumers after server reached maximum memory and with a significant portion of the process swapped to disk. Just about the same as it was without external memory pressure.
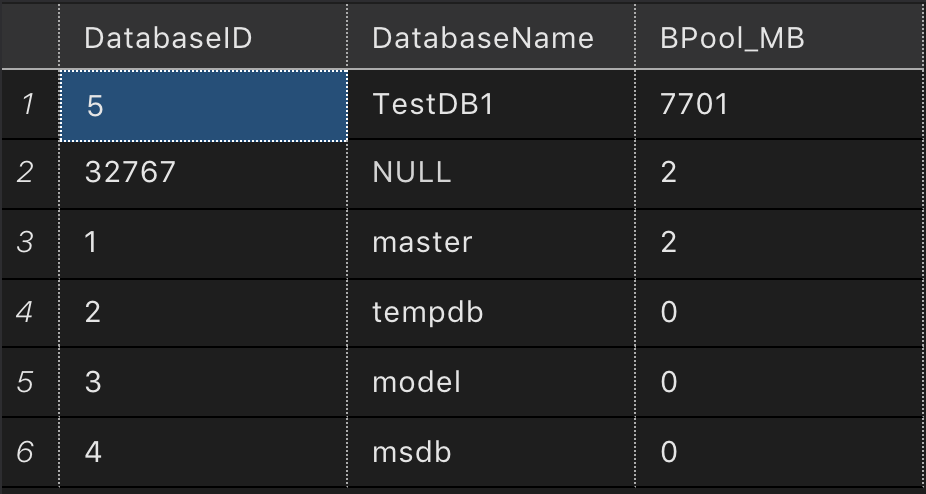
Figure 6 – Buffer Pool memory distribution after table loaded and with a significant portion of the process swapped to disk. Just about the same as it was without external memory pressure.
Things aren’t what they seem
Looking at wait stats during query execution is going to be a little more interesting when SQL Server thinks it’s data pages are in memory, but a significant portion of them are actually on disk. In fact, when querying my test table with a simple SELECT COUNT(*) the wait types don’t indicate the fact that SQL Server is now actually disk bound due to the large portions of the buffer pool being paged out to disk. Under normal conditions, this query takes 11 seconds to run…when we’re paging to disk, it takes 2 minutes and 11 seconds to run.
So let’s check out the wait types reported during our query output here in Figure 7. We see SOS_SCHEDULER_YIELD…which makes sense…long running query, that’s pretty slow and it’s quantum is being exhausted and the thread is being rescheduled. We do see some disk IO waits with PAGEIOLATCH_SH, but not much…what’s happening here is my data table is 8GB and my Max server memory is also 8GB so there’s a little overflow there and will read from disk for some of the data. From a performance standpoint, SQL Server has no idea that it’s data pages are likely swapped out to in this low memory situation. It thinks those pages are in the buffer pool…they certainly are…but a large chunk of the buffer pool is now actually swapped out to disk.

Figure 7 – Wait types reported during query execution with a significant portion of the process swapped to disk. Wait stats query from @brento
What does this all mean?
Well, SQL Server is on a new operating system now, Linux. It’s upon us as DBAs to know how our system works as a whole and what to do when we’re in situations where performance falls off a cliff due to memory contention. This case is certainly a contrived case by putting so much external pressure on our process…but you, the DBA, need to know how SQL Server on Linux is going to react in these conditions and how to get your system back on track when things go south. Good monitoring and also good system resource management are needed. Certainly a properly size system in terms of physical memory and swap file size is needed. We toed the line here in our example ensuring we didn’t exceed physical memory plus swap file size. If you do exceed physical and swap size memory allocations will fail and your process will likely crash or be killed.
Speaking of monitoring, I’m speaking at PASS Summit this year on…you guessed “Monitoring Linux Performance for the SQL Server Admin” on Friday November 3th at 8am. If you want to learn more, I’ll see you there.