SQL Server on Linux – External Memory Pressure with 2019 CTP2
In this blog post we’re going to revisit how SQL Server on Linux responds to external memory pressure. This is a very long post, and it ends with me not knowing exactly what’s going on…but the journey is pretty fun…let’s go!
On Windows-based SQL Server systems we’ve become accustomed to the OS signaling to SQL Server that there’s a memory shortage. When signaled, SQL Server will kindly start shrinking it’s memory caches, including the buffer pool, to maintain overall system stability and usability. Well that story is a little different in SQL Server on Linux…last year I wrote a similar post for SQL Server 2017 RTM and how it reacted to external memory pressure, check that out here! That was quite a dramatic story, you can literally cause SQL Serve to swap nearly its entire process address space out to disk! Now, let’s look and see how SQL Server on Linux responds to external memory pressure in SQL Server 2019 CTP2.
The Scenario
Our SQL Server on Linux system is a CentOS 7.5 VM, running SQL Server 2019 (CTP2). There is 12GB of physical memory and 80% of that is dedicated to SQL Server via mssql-conf about 9.2GB, the default configuration. I’ve also set Max Server memory to 8GB for the SQL Server instance.

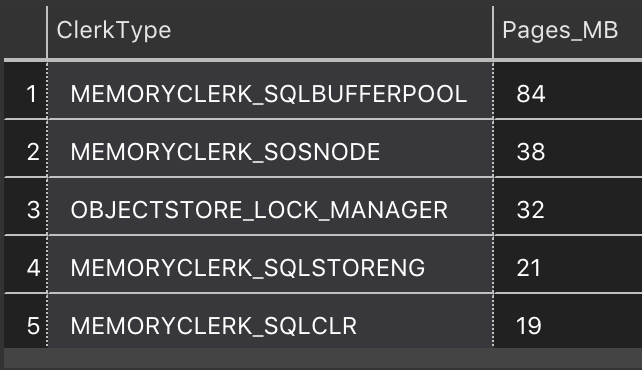
So let's start up SQL Server on Linux 2019 CTP2 and query the SQL Server's cache sizes when there’s no data loaded. I’m going to look in  <a href="https://docs.microsoft.com/en-us/sql/relational-databases/system-dynamic-management-views/sys-dm-os-memory-clerks-transact-sql">`sys.dm_os_memory_clerks`</a> for memory allocation accounting information. In Figures 1 we can get a feel for the memory distribution across the system’s caches. Special shoutout to the new “<a href="https://azure.microsoft.com/en-us/updates/azure-data-studio-is-now-available/">Azure Data Studio</a>” I’m using in these demos.

Figure 1 – Top memory consumers at system startup
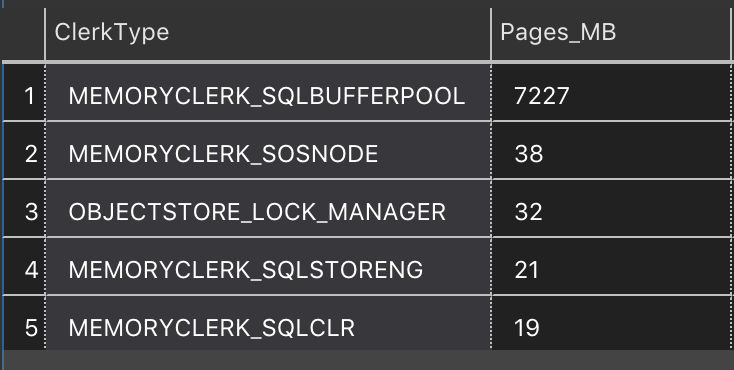
Now, I’m going to load an 8GB table into the buffer pool, maxing out SQL Server’s MAX memory instance setting. Now we’ll look at the allocations again. In Figure 2, we can see the buffer pool is the dominant consumer of memory and that our database is the dominant consumer in the buffer pool. So far so good, eh?

**Figure 2 **– Top memory consumers after server reached maximum memory
Getting Memory Information From Linux
We can use tools like `ps`, `top` and `htop` to look our are virtual and physical memory allocations. We can also look in the `/proc` virtual file system for our process and look at the `status` file. In here we’ll find the point in time status of a process, and most importantly the types of memory allocations for a process. We’ll get granular data on the virtual memory allocations and also the resident set size of the process. Here are the interesting values in the `status` file we’re going to focus on today.
- `VmSize` – total current virtual address space of the process
- `VmRSS` – total amount of physical memory currently allocated to the process
- `VmSwap` – total amount of virtual memory currently paged out to the swap file (disk)
We can use the command `pidof sqlservr` to find the process ID for our SQL on Linux process, in our case it’s 14689. When running SQL Server on Linux there is always two processes for `sqlservr`, we’re going to look the one with the higher process ID as the one with the lower PID is the watchdog process.

Now to access the `status` information for our process we look in `/proc/14689/status`

Below is the output from our process' `status` file, filtering for the values we’re interested in. You can see about 16.4GB of Virtual Memory (`VmSize`), 7.9GB of which is in actual RAM (`VmRSS`) and 0MB in the swap file (`VmSwap`). Wait a second, 16GB of for `VmSize`? Yea, 16GB for `VmSize`. That’s the reserved allocation for the whole process. More on that in a second…

VmSize:  17165472 kB

VmRSS:    8579016 kB

VmSwap:         0 kB

**<br />**

**Table 1 **– Process memory for SQL Server 2019
Now, if we look back at the previous post here on SQL Server 2017 RTM, the memory distribution was a bit different. We see about 10.16GB of memory in VmSize
<br />
VmSize:  10661380 kB

VmRSS:    8201240 kB

VmSwap:         0 kB

<br />

  **Table 2 **– Process memory for SQL Server 2017
Phantom Memory Allocation?
Now, I very rarely post something when I don’t have an answer for a specific behavior but this case I don’t. My thoughts on this are, that 16GB is the reserved allocation for the whole process. Linux uses a demand paging allocation system so the majority of the process access space is just a reservation and isn’t backed by actual pages. So it’s not really consuming physical memory. But what I do find interesting is the process seems to carry that allocation forward, as I loaded memory in, the VmSize went from 8GB (which is the VmSize when SQL Server Starts) to 16GB (when I loaded the 8GB table). I’ve reported this to the product team and I am awaiting for an answer on the ~8GB discrepancy between the two tests.
Let’s Add Some Pressure
Using a small C program I wrote, I use `<a href="https://linux.die.net/man/3/calloc">calloc</a>` to allocate large sections of contiguous memory and then I have the program continually write data into the memory buffer to ensure those pages stay in physical memory. Using this program, let’s allocate 7GB of RAM. I’m choosing this value because its going to cause my system to exceed it’s physical memory but NOT exceed the amount virtual memory in my system when including the swap file’s size which is 5.8GB on my system. Things can get really dicey if you exceed physical and virtual memory size, processes will start to get killed. Microsoft documents a case <a href="https://blogs.msdn.microsoft.com/psssql/2017/10/17/how-to-safeguard-sql-server-on-linux-from-oom-killer/">here</a>. Just so you know how important adding a monitor for external memory pressure is, when I allocated 7.5GB and exceeded physical + virtual memory Linux killed both the memory allocation program and SQL Server to protect the stability of the system, oomkiller is a thing to look out for!

Now, let’s look at the memory accounting information at `/proc/PID/status` for my memory allocator program. In the output below you can see we have just about 7GB of virtual memory (`VmSize`) allocated and nearly the same amount of memory that’s resident in physical memory (`VmRSS`) and no data in the swap file.

VmSize:  7344248 kB

VmRSS:   7340312 kB

VmSwap:        0 kB
Table 3: Process memory for external memory allocation program
Now in** SQL Server 2017** with that 7GB program running would cause Linux to need to make room in physical memory for this process. Linux does this by swapping least recently used pages from memory out to disk. So under external memory pressure, let’s look at the SQL Server process’ memory allocations according to Linux. In the output below we see we still have a VmSize of around 10GB, but our VmRSS value has decreased dramatically. In fact, our VmRSS is now only 2.95GB. VmSwap has increased to 5.44GB. Wow, that’s a huge portion of the SQL Server process swapped to disk.
VmSize:  10700328 kB

VmRSS:    3098456 kB

RssAnon:  3096308 kB

VmData:  10442840 kB

VmSwap:   5711856 kB

**Table 4 **– Process memory for SQL Server 2017 on Linux under external memory pressure

In **SQL Server 2019**, there’s a different outcome! In the data below we see our 16GB `VmSize` which won’t change much because of the virtual address space for the process. With that large external process running SQL Server reduced `VmRSS` from 7.9GB (from Table 1) to 2.8GB only placing about 4.68GB in the swap file. That doesn’t sound much better, does it? I thought SQL Server was going to react to the external memory pressure…let’s keep digging and ask SQL Server what it thinks about this.

VmSize:  17159552 kB

VmRSS:    2938684 kB

VmData:  16806460 kB

VmSwap:   4911120 kB

**<br />**

**Table 5 **– Process memory for SQL Server 2019 on Linux under external memory pressure
What’s SQL Server Think About This?
In SQL Server on Linux 2017, we saw a large chunk of the process address space swap out and we saw those pages stay resident in SQL Server’s buffer pool or really any part of the SQL Server process address space since the Linux kernel is an equal opportunity swapper…so anything in the caches managed by SQL Server didn’t know if that memory was resident in physical memory or was actually on disk. In figure 3, we see the top memory consumers after external memory pressure, our buffer pool is still fully populated with our table data.

<img loading="lazy" style="display: block; margin-left: auto; margin-right: auto;" title="Screen Shot 2018-10-13 at 8.24.02 AM.png" src="/images/2018/10/Screen-Shot-2018-10-13-at-8.24.02-AM.png" alt="Screen Shot 2018 10 13 at 8 24 02 AM" width="366" height="178" border="0" />

**Figure 3 **– Top memory consumers after external memory pressure in SQL Server 2017

<br />
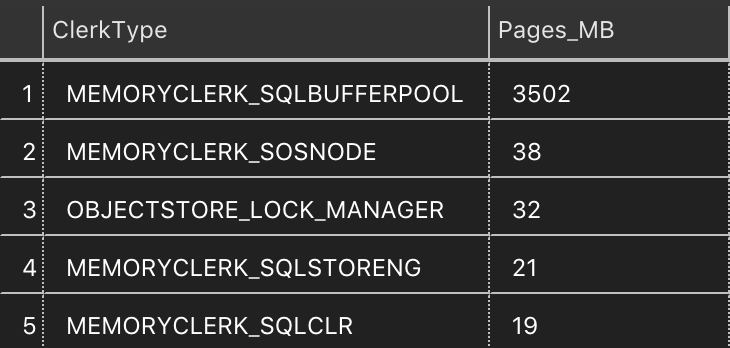
Ok, let’s look at what happens in SQL Server 2019 with external memory pressure. Looking at the memory distribution, we see that the memory clerk for SQL Server’s buffer pool reduced its memory footprint from 7,227MB (the value from way back in Figure 2) when the buffer pool was first loaded with our large table. Wh then applied external memory pressure with our 7GB process and now we see the buffer pool is reduced to 3,502MB a reduction of 3,725MB. Cool, looks like we dumped our buffer pool to protect the system but not the whole buffer pool, there’s still 3,502MB in memory. But the SQL Server 2019 on Linux process still swapped out about that much data (Table 5)…what’s going on? I still don’t know. Let’s keep digging.

**Figure 4 **– Top memory consumers after external memory pressure in SQL Server 2019

<br />

Now, in SQL Server 2017 on Linux Resource Monitor didn’t exist…let’s look at what we have in SQL Server 2019…using the query from <a href="https://twitter.com/banerjeeamit">Amit Banerjee</a> and <a href="https://thesqldude.com">Sudarshan Narasimhan</a> in this post <a href="https://blogs.msdn.microsoft.com/sqlserverfaq/2010/08/25/the-hidden-gems-among-dmvs-sys-dm_os_sys_memory/">here</a> let’s see what happened according to the newly implemented Resource Monitor for SQL Server 2019 on Linux.

**Figure 5 **– Resource Monitor output before and after external memory pressure
From the output of this query, we can see that System Indicator is 2 during periods of external memory pressure. This is a signal from Resource Monitor to SQL Server to dump its caches to protect the health of the overall system. We certainly observed that in the output in Figure 4. But what we also found is that Linux is placing 4.68GB of memory into the swap file and that SQL Server is holding on to 3,502MB of memory in the buffer pool while the VmRSS of the process is 2.8GB (Table 5). So the question remains, why is SQL Server swapping so much of its memory out to disk and holding on to so much memory in the buffer pool even though it’s seeing the low memory signal from Resource Monitor. This data is further backed up by the fact that we see SQL_CommitedMemory_KB staying relatively stable in the light of the external memory pressure, the expectation is that would reduce. So it’s like it’s not quite finishing the job deallocating the memory. So let’s ask Linux what it thinks about this.
Resource Monitor on Linux – How I think it works…
If you’ve read this blog before you know I like to use strace to find out how applications interact with the OS via system calls. Well, let’s use that technique to try to figure out what happens when SQL Server starts dumping it’s cache under external memory pressure.
In the last section, we learned that Resource Monitor can track high and low memory conditions in Linux. In this section, let’s see how it interacts with the Linux memory management system to deallocate memory.
In the output below (Table 6) you can see the aggregated system calls when I’m applying external memory pressure to SQL Server on Linux. From that output, it looks like SQL Server on Linux uses memory mapped files, which is a file access technique where files are opened mapped directly into a process’ memory address space. The process can then access the file via direct memory addressing rather than using system calls. This type of access actually makes quite well to the internal file structures used in SQL Server data files.
During external memory pressure, the <a href="https://linux.die.net/man/2/madvise">madvise</a> is the most frequently called system call during this period. This system call is used by applications to advise (hint) the kernel on what to do with ranges of memory under certain conditions. In the last section, we observed that Resource Monitor can sense the external memory pressure and signals SQL Server to clear its caches and this is likely the implementation of how those caches are dumped.
Under memory pressure, the madvise system call is called with the MADV_DONTNEED flag for large address ranges in SQL Server’s process address space, the memory mapped file. The MADV_DONTNEED flag tells the kernel that the application does not expect to access these pages in the near future and they can be discarded and eventually freed rather than swapped out to disk. See the kernel source code here for how it works.
madvise(0x69274a000, 8192, MADV_DONTNEED) = 0
My theory is that this is how Resource Monitor is signaling to the OS that these pages are no longer needed and should be deallocated due to the semantics of the madvise system call the pages are marked as not needed. So we see the reduction in the size reported by SQL Server’s memory clerks. But what I find interesting is the amount of memory that’s still hitting swap when we look at the memory accounting information for the individual processes and the IO profile of the system during external memory pressure. So it seems like the kernel or the application is holding onto pages and they’re hitting swap rather than being deallocated.
This is just my theory and I’m trying to bring the pieces together in this emerging technology since it’s still in CTP. So if you have some insight as to what’s happening at this layer, I’d love to hear from you:)
strace -p PID -f -c

% time     seconds  usecs/call     calls    errors syscall

—— ———– ———– ——— ——— —————-

 75.98  575.483472       12188     47217     11425 futex

  8.24   62.370591      275976       226           epoll_wait

  7.73   58.578205     2253008        26        14 restart_syscall

  3.44   26.050226     2170852        12           io_getevents

  1.60   12.096475      549840        22           nanosleep

  1.55   11.726022      266501        44        44 rt_sigtimedwait

  0.71    5.387356          14    389517           clock_gettime

  0.49    3.688034          24    154405           madvise

  0.12    0.944458         803      1176           munmap

  0.07    0.495154         343      1445           mmap

  0.06    0.444399        7796        57           open

  0.01    0.062301        1093        57           read

  0.00    0.013327         579        23        23 stat

  0.00    0.009003          46       196           gettid

  0.00    0.005058          43       119           sched_setaffinity

  0.00    0.004188          68        62           clone

  0.00    0.004018          65        62           set_robust_list

  0.00    0.003902          36       109           rt_sigprocmask

  0.00    0.003194          56        57           fstat

  0.00    0.002914          47        62           sched_getaffinity

  0.00    0.002331          38        62           sigaltstack

  0.00    0.001805          29        62           arch_prctl

  0.00    0.001575          28        57           close

  0.00    0.001182         394         3           io_submit

  0.00    0.000672          42        16           sched_yield

  0.00    0.000506          22        23           rt_sigaction

  0.00    0.000011          11         1           fdatasync

—— ———– ———– ——— ——— —————-

100.00  757.380379                595118     11506 total

**Table 6:** Aggregated system calls for SQL Server on Linux under external memory pressure

 % time     seconds  usecs/call     calls    errors syscall

—— ———– ———– ——— ——— —————-

 71.52  569.206916       33673     16904      4444 futex

 12.46   99.164048      819538       121           epoll_wait

  6.90   54.920907     2387866        23        17 restart_syscall

  2.73   21.715336        1084     20033           io_getevents

  2.15   17.123567     1902619         9           nanosleep

  2.07   16.494124      868112        19        19 rt_sigtimedwait

  1.77   14.122895        1070     13202           io_submit

  0.22    1.780524         218      8180           munmap

  0.10    0.769185          93      8262           mmap

  0.06    0.502749         125      4026           clock_gettime

  0.00    0.006171         386        16           sched_setaffinity

  0.00    0.005702          62        92           read

  0.00    0.004128         197        21           fstat

  0.00    0.003996         118        34           sched_yield

  0.00    0.003961         165        24           gettid

  0.00    0.003112         346         9           arch_prctl

  0.00    0.002615         291         9           sched_getaffinity

  0.00    0.002528          84        30           rt_sigprocmask

  0.00    0.002045          85        24           close

  0.00    0.001929          92        21           open

  0.00    0.001924         214         9           clone

  0.00    0.001752         195         9           set_robust_list

  0.00    0.001647          97        17           madvise

  0.00    0.001198         599         2           fdatasync

  0.00    0.000989         110         9           sigaltstack

  0.00    0.000632          57        11        11 stat

  0.00    0.000446          45        10           rt_sigaction

  0.00    0.000351          18        19           write

  0.00    0.000316          11        29           epoll_ctl

  0.00    0.000310          44         7           writev

  0.00    0.000159          11        15         7 readv

  0.00    0.000051          26         2           socket

  0.00    0.000021          11         2           setsockopt

  0.00    0.000014           4         4           getcpu

  0.00    0.000009           3         3           getsockname

  0.00    0.000009           5         2           getpeername

  0.00    0.000004           4         1           accept

  0.00    0.000004           2         2           fcntl

—— ———– ———– ——— ——— —————-

100.00  795.846274                 71212      4498 total

**Table 7:** Aggregated system calls for SQL Server on Linux under external memory pressure